How your savings
are calculated
The savings calculation is based on the household's measured data and is designed to provide as fair and personalized an estimate as possible.
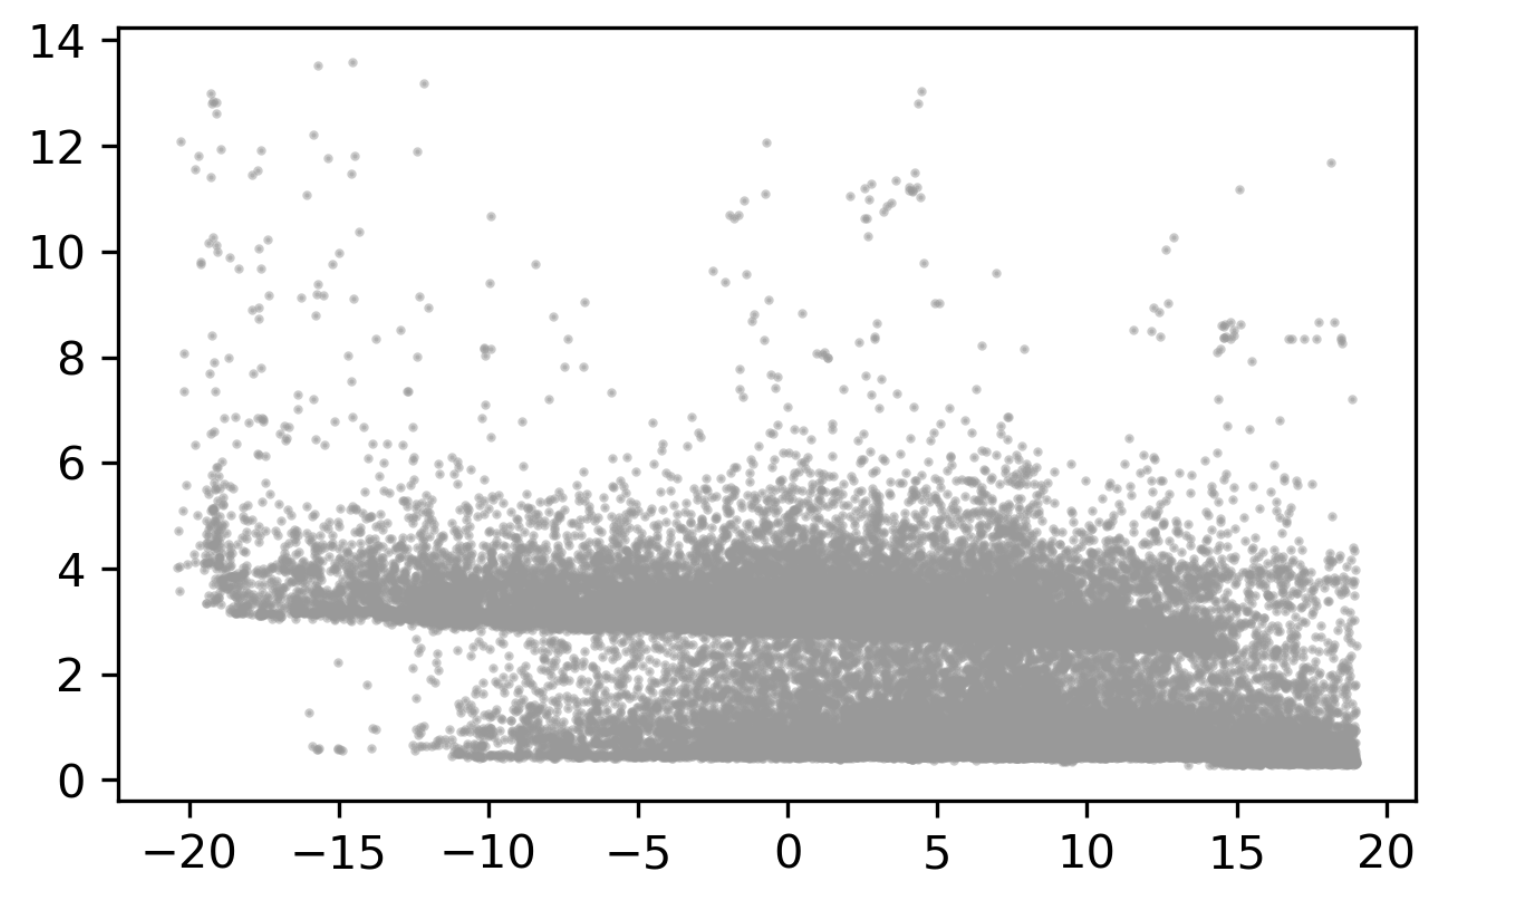
Raw data from a household: power (kW) vs temperature (°C). The irregular pattern shows why filtering is necessary.
Step 1
Data collection and filtering
The calculation is based on energy data collected from your household. To ensure quality, the data is filtered in a first step. This means that outlier measurements are removed and that the analysis focuses on the part of energy use that actually relates to heating.
This is an important prerequisite for the model to work with relevant and comparable data, without being affected by temporary variations or noise.
Raw data contains thousands of measurement points. The filtering distils these into a clean, representative dataset — the foundation for everything that follows.
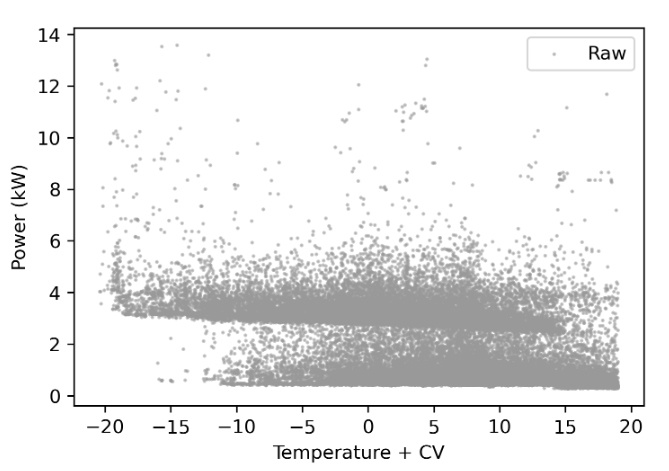
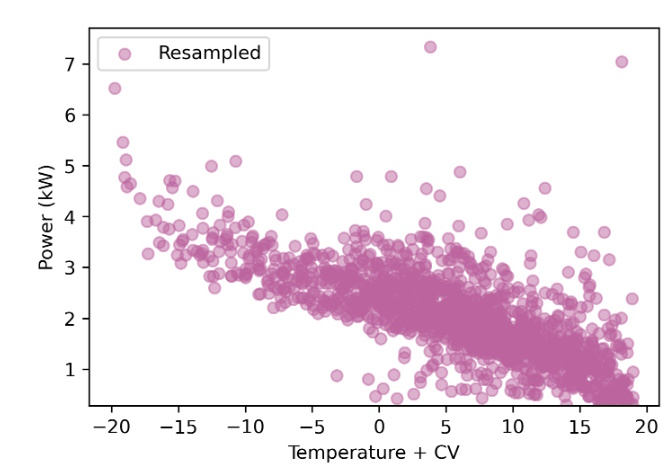
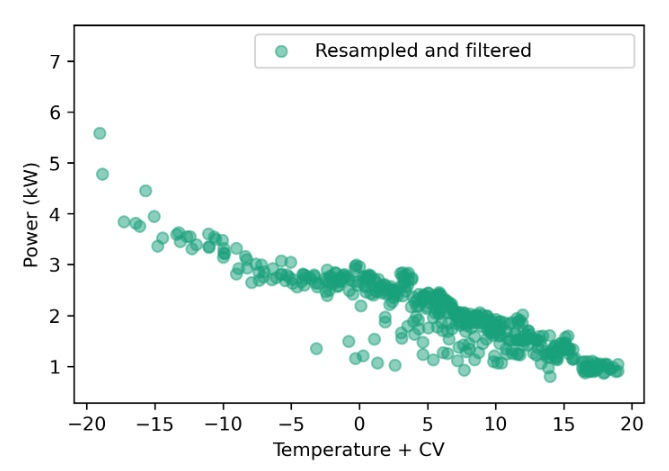
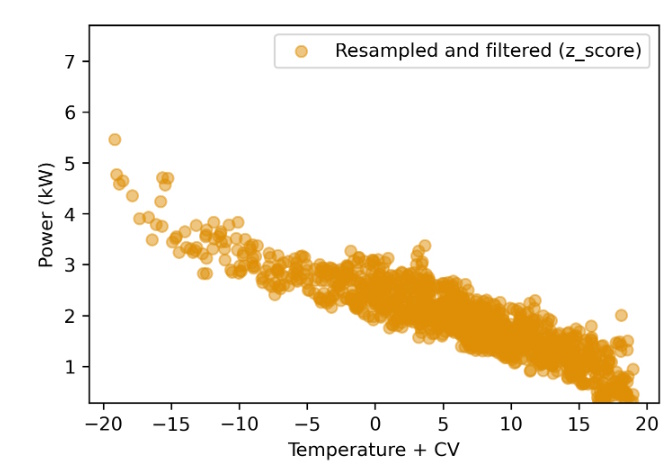
Filtering pipeline in four steps: from raw data (grey) via resampling (pink) and band filtering (green) to final z-score filtering (orange). Each step removes noise and outliers.

Step 2
An individual model for your home
Once the data has been prepared, a calculation model is created that is tailored to your specific household. The model is based on a tree-based machine learning method (XGBoost), which is particularly well-suited for identifying complex patterns in data.
The method uses so-called boosting — many smaller decision trees are built up incrementally, where each new step focuses on improving the errors made by previous steps.
Through this approach, the model can capture how different factors interact, even when the relationships are non-linear or not immediately obvious.
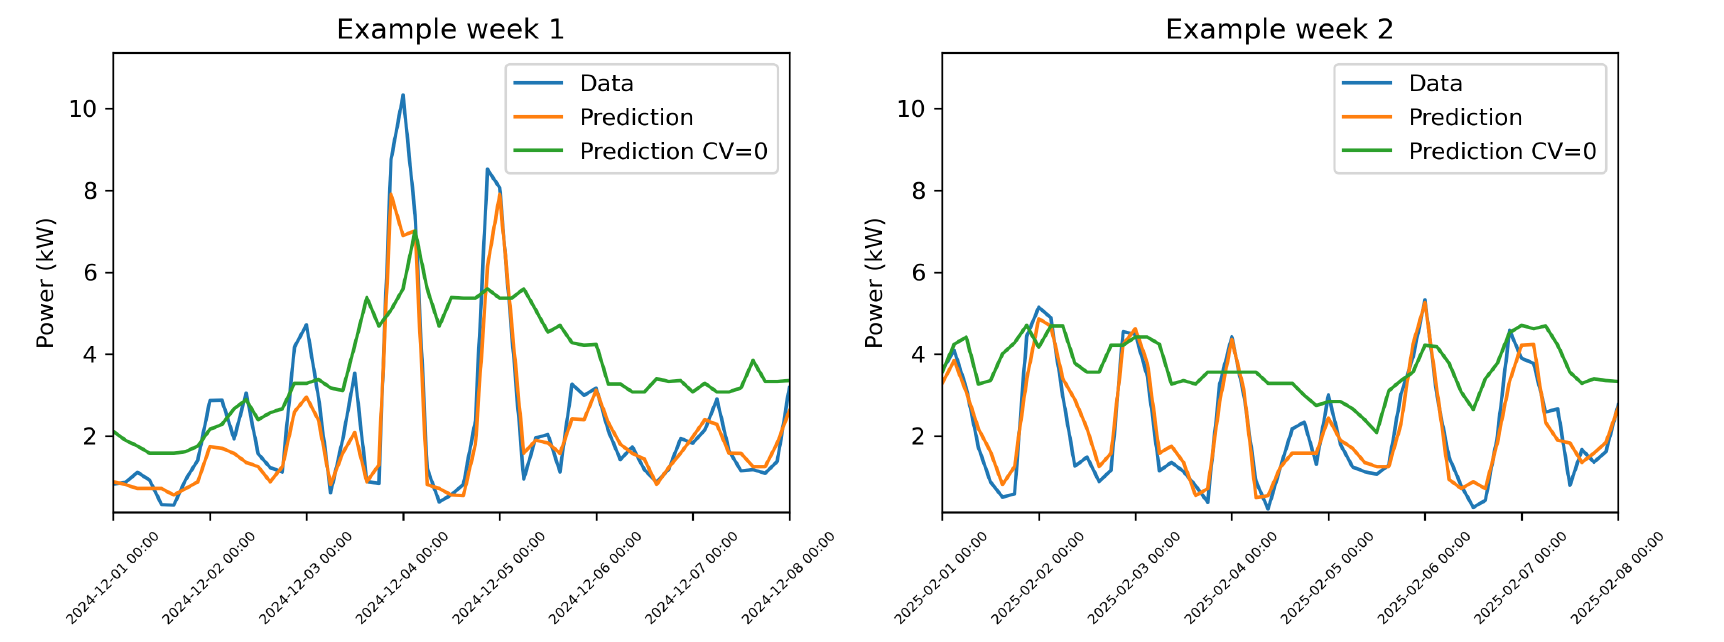
Model verification for two example weeks. Blue curve = actual consumption. Orange = model prediction. Green = prediction without Tune control (CV=0). The close match confirms the model's accuracy.
Step 3
The relationship between heat and environment
The model is trained to understand how the household's heat consumption is affected by external factors. This primarily concerns outdoor temperature, but also how heating is controlled over time through the Tune system. The result is a description of how your specific home responds to changes — for example how much energy is required at different temperatures and how the control affects this.

Step 4
Comparison between two scenarios
To estimate the saving, the model is used to compare two scenarios for a chosen time period — with identical outdoor temperatures as a common basis.
With Ngenic Tune
Actual control from Ngenic Tune — optimised heating during the selected period.
Without optimisation
Reference scenario — what energy use would have looked like without Tune's influence (CV = 0).
Both scenarios are based on the same measured outdoor temperatures. The difference can therefore be directly attributed to optimisation — not to weather or other external factors.
Step 5
From energy to cost
The calculated energy saving is converted into a cost saving using current electricity or district heating prices and grid fees — so that the result reflects the real conditions for your specific household.
Data source
Two ways to build the model
The model can be created in two ways depending on whether the household has Ngenic Track installed or not.
With Track
Currently, the savings calculation is based on detailed measurement data from Ngenic Track — a real-time meter that connects to the electricity meter's HAN port or via optical reading of electricity or district heating meters.
The more data that has been collected, the better the model can be adapted to the household's actual behaviour.
Without Track
For households without their own measurement data, a model will instead be based on similar properties. Information such as energy consumption, year of construction, area and Tune's control is used to match comparable houses.
A representative model provides an estimate of the saving, even without direct measurement.

Start saving energy for real
Join thousands of smart homeowners who have already optimised their heating. Easy installation, immediate control.
Installed in under 15 minutes